
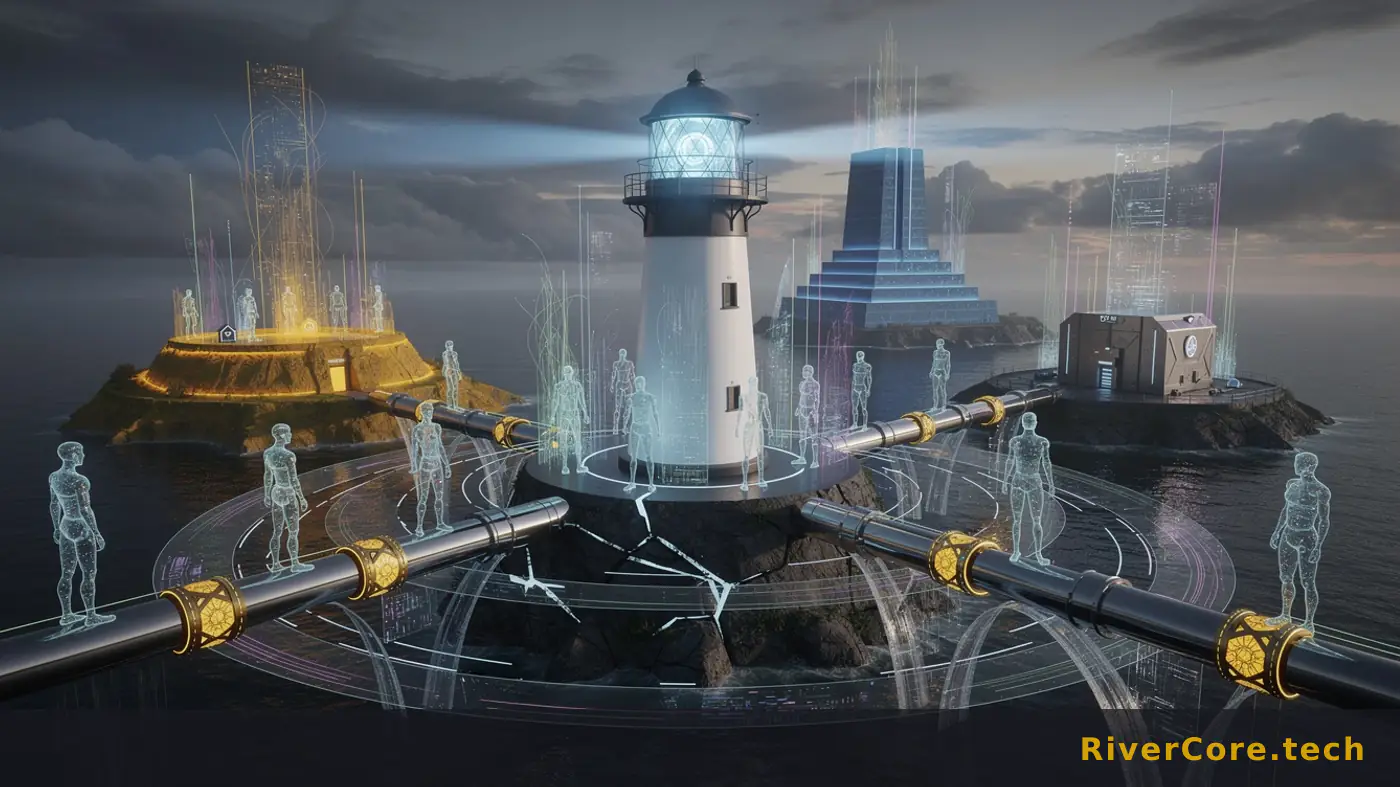
AgentCore Observability Goes Multi-Cloud: What ADOT Actually Does
If you're running Strands, LangGraph, or CrewAI agents in production today, there's a decent chance they're not all in one place. Some live in EKS, some in Lambda, some in a GCP project your data team owns, and one embarrassing pilot is still running on a VM under someone's desk. AWS just published the wiring diagram for pulling telemetry from all of those back into a single dashboard, and it's worth reading closely before you commit to it.
The Problem
Amazon Bedrock AgentCore Observability, as Amazon Web Services (AWS) describes it, provides native tracing, monitoring, and analytics for agents, but the native support only covers agents deployed on the AgentCore runtime inside the AWS Cloud. Everything else, meaning EKS, ECS, Lambda, on-prem, GCP, and Azure, requires manual instrumentation to get telemetry into the same dashboard. That is the gap this post closes.
The engineering problem underneath is familiar to anyone who has tried to centralize observability across clouds. Agent frameworks emit spans in different shapes. Strands, LangGraph, and CrewAI each have their own view of what a "reasoning step" or a "tool call" looks like. Model calls through boto3 produce yet another layer. Without a common semantic convention, your dashboard ends up being three dashboards in a trench coat, and you can't answer basic cost or safety questions across environments.
The constraint that has actually shifted is on the vendor side. AgentCore Observability supports Strands, LangGraph, and CrewAI as first-class frameworks, but only if the agents run on AgentCore runtime. That's a narrow deployment surface. Most teams I talk to have at least one agent running outside that box, often for latency, data residency, or existing platform investment reasons. So AWS is now telling those teams: use the OpenTelemetry pathway, and we'll ingest.
The source does not disclose per-request ingestion pricing for the CloudWatch OTLP endpoint in this walkthrough, which matters because agent workloads can emit dozens of spans per user turn. We don't know the effective cost per agent-hour under this pattern, but the upper bound is whatever CloudWatch Logs and X-Ray ingestion cost at your span volume, and that number needs to be modeled before you turn this on across a fleet.
Options on the Table
There are basically four ways to instrument a multi-cloud agent fleet today, and this AWS pattern is one of them.
Option 1: The AWS pattern described here. Run aws-opentelemetry-distro (minimum version 0.10.0) in-process with your agent, use opentelemetry-instrument to inject auto-instrumentation into the Python runtime, and export via SigV4 to the CloudWatch OTLP endpoint. ADOT patches boto3 for Bedrock calls and patches the Strands framework for agent reasoning spans automatically. You get the AgentCore dashboard, and everything routes through CloudWatch as the ingestion and storage foundation. Requires nine specific IAM permissions across bedrock, logs, xray, and cloudwatch scopes.
Option 2: Vanilla OpenTelemetry to a neutral backend. Point your agents at a self-hosted or SaaS OTel collector (Grafana Tempo, Honeycomb, Datadog, Signoz) using the same OTel semantic conventions for generative AI. You lose the AgentCore-specific dashboard views, but you don't pay CloudWatch ingestion for agents that already live outside AWS, and you keep your observability backend portable. Trade-off: no native "agent reasoning chain" view unless your vendor has built one.
Option 3: Framework-native telemetry. LangGraph has LangSmith. CrewAI has its own tracing. Strands emits OpenTelemetry-shaped spans via the strands-agents[otel] package following gen AI semantic conventions, including reasoning steps, tool invocations, and model calls with token usage. Cheapest to set up per framework, but you end up with N dashboards for N frameworks, which is exactly the fragmentation problem you were trying to solve.
Option 4: Do nothing centralized, log locally. Still the default for a surprising number of teams. Fine for a prototype, indefensible in production once agents start making tool calls that touch payments, user data, or third-party APIs.
The AWS pattern versus vanilla OTel is the real decision. If your center of gravity is already AWS and you want the AgentCore-specific views into agent reasoning, this is the shorter path. If your center of gravity is GCP or Azure and you're only reaching into AWS for Bedrock model access, paying CloudWatch to be your observability backend is a strange choice you should justify explicitly. The source does not disclose whether the AgentCore dashboard will ever accept telemetry from non-CloudWatch backends, which matters because that answer determines whether this is a bridge or a funnel.
What Engineering Teams Should Actually Do
My take: if you're already using Bedrock models for inference, adopting this pattern for your non-AWS agents is a reasonable near-term move, but treat the credentials story as the gating decision, not the SigV4 plumbing.
The walkthrough uses AWS_ACCESS_KEY_ID and AWS_SECRET_ACCESS_KEY as environment variables, which is fine for a laptop demo and unacceptable for a production fleet running across GCP nodes and on-prem hosts. The post itself recommends IAM Roles Anywhere for production, which lets on-prem workloads obtain temporary credentials using X.509 certificates. That's the right call, and it should be your day-one setup, not a day-ninety migration. Standing up a PKI to issue those certs is real work, and if you don't have one, that's the actual project, not the ADOT install.
For the instrumentation itself, the install is a one-liner: pip install "aws-opentelemetry-distro>=0.10.0" boto3 "strands-agents[otel]". Add the nine IAM permissions, run the one-time aws xray update-trace-segment-destination --destination CloudWatchLogs --region us-east-1 to turn on Transaction Search, verify with the get-destination call (expect {"Destination": "CloudWatchLogs", "Status": "ACTIVE"}), and you're wired.
Before rolling this out fleet-wide, do the cost model. Instrument one representative agent, run it against a realistic workload for a week, pull the CloudWatch bill for that log group, and multiply. If the number looks bad, fall back to sampling or move to Option 2. A testable prediction: teams that deploy this pattern without a sampling strategy will see their CloudWatch bill grow non-linearly with agent invocation count within the first billing cycle. If that doesn't happen, either your traffic is low or you got the sampling defaults right by accident.
Gotchas and Edge Cases
A few things worth flagging from the setup as described.
The OTEL_EXPORTER_OTLP_LOGS_HEADERS header is what routes logs to the specific AgentCore log group so CloudWatch indexes them under the gen AI observability dashboard. Get this wrong and your telemetry arrives but doesn't appear in the dashboard you built this whole thing for. It'll look like an ingestion failure when it's actually a routing failure.
The auto-instrumentation patches boto3 and the Strands framework specifically. If your agent uses a custom HTTP client to hit Bedrock, or a fork of Strands, or wraps LangGraph in a way the ADOT auto-instrumentation doesn't recognize, you'll get partial traces. The source describes patching for Strands explicitly and mentions LangGraph and CrewAI as supported frameworks, but the walkthrough only demonstrates Strands with Claude Haiku. We don't know the fidelity of auto-instrumentation on LangGraph and CrewAI relative to Strands, and that gap is worth measuring before you standardize.
Python 3.10 or later is required. If you have agents pinned to 3.9 for compatibility reasons, that's a blocking upgrade.
Finally, outbound HTTPS to AWS endpoints is a prerequisite. In regulated on-prem environments where egress is proxied or restricted, expect a security review before ADOT can talk to the CloudWatch OTLP endpoint. That review is usually longer than the code change.
Key Takeaways
- AgentCore Observability now has a documented path for agents running on EKS, ECS, Lambda, on-prem, GCP, and Azure via ADOT auto-instrumentation and SigV4 to the CloudWatch OTLP endpoint.
- The install is simple (
aws-opentelemetry-distro>=0.10.0, boto3,strands-agents[otel], plus nine IAM permissions), but the credentials story is the real work: use IAM Roles Anywhere with X.509 certs, not long-lived access keys. - Turn on CloudWatch Transaction Search once per account with the documented X-Ray command, and verify you see
Status: ACTIVEbefore instrumenting anything. - Model the CloudWatch ingestion cost against realistic span volume before fleet rollout. Agent workloads emit many spans per turn, and the source does not disclose per-span pricing for this pathway.
- The walkthrough only demonstrates Strands with Claude Haiku. LangGraph and CrewAI are listed as supported but auto-instrumentation fidelity across those frameworks is an open question worth validating in your own environment.
Frequently Asked Questions
Q: Does AgentCore Observability work with agents running outside AWS?
Not natively. AgentCore Observability only natively supports agents deployed on the AgentCore runtime in the AWS Cloud. For agents on EKS, ECS, Lambda, on-prem, GCP, or Azure, you configure AWS Distro for OpenTelemetry (ADOT) auto-instrumentation to export telemetry via SigV4 to the CloudWatch OTLP endpoint.
Q: What frameworks does AgentCore Observability support for monitoring?
The capability supports agents built with the Strands Agents, LangGraph, and CrewAI frameworks. The walkthrough specifically demonstrates Strands with Claude Haiku, using the <code>strands-agents[otel]</code> package to emit spans that follow OpenTelemetry generative AI semantic conventions, including reasoning steps, tool invocations, and model calls with token usage.
Q: How should production deployments handle AWS credentials for non-AWS agents?
The source recommends IAM Roles Anywhere instead of long-lived access keys. IAM Roles Anywhere allows on-premises workloads to obtain temporary credentials using X.509 certificates, which avoids the risk of leaked static access keys sitting in environment variables across a distributed fleet.

The Phantom Research Paper: When Press Release SEO Poisons the Signal
A press release URL promising research on backend architecture failures resolves to a Des Moines Register homepage of football rankings and a $2M rural physicians request. What's going on.

SEC Crypto FAQ Tackles Buybacks, Upgrades, Profit Promises
The SEC quietly dropped a crypto FAQ covering token buybacks, network upgrades, and profit promises. Small document, big consequences for token designers.

Multi-Model AI Just Became a Platform Problem, Not a Vendor One
Anthropic shipped Opus 5.5, OpenAI shipped GPT-6 Sol and Luna, and Palo Alto Networks quietly admitted no single model catches more than 40% of vulnerabilities.